I. Introduction

This unit summarizes the principles and applications of isotopologue distributions

Use the left-hand menu to navigate between sections, or click the button below to begin.

Preamble

How do you tell the difference between an alligator and a crocodile?

You might be able to distinguish based on appearance or habitat. This would work as long as you encountered a whole, living animal.

But what if you didn’t?

What if you only had a tooth?

Or a vial of blood?

Or a couple of skin cells in a place where the animal once walked?

What about DNA?

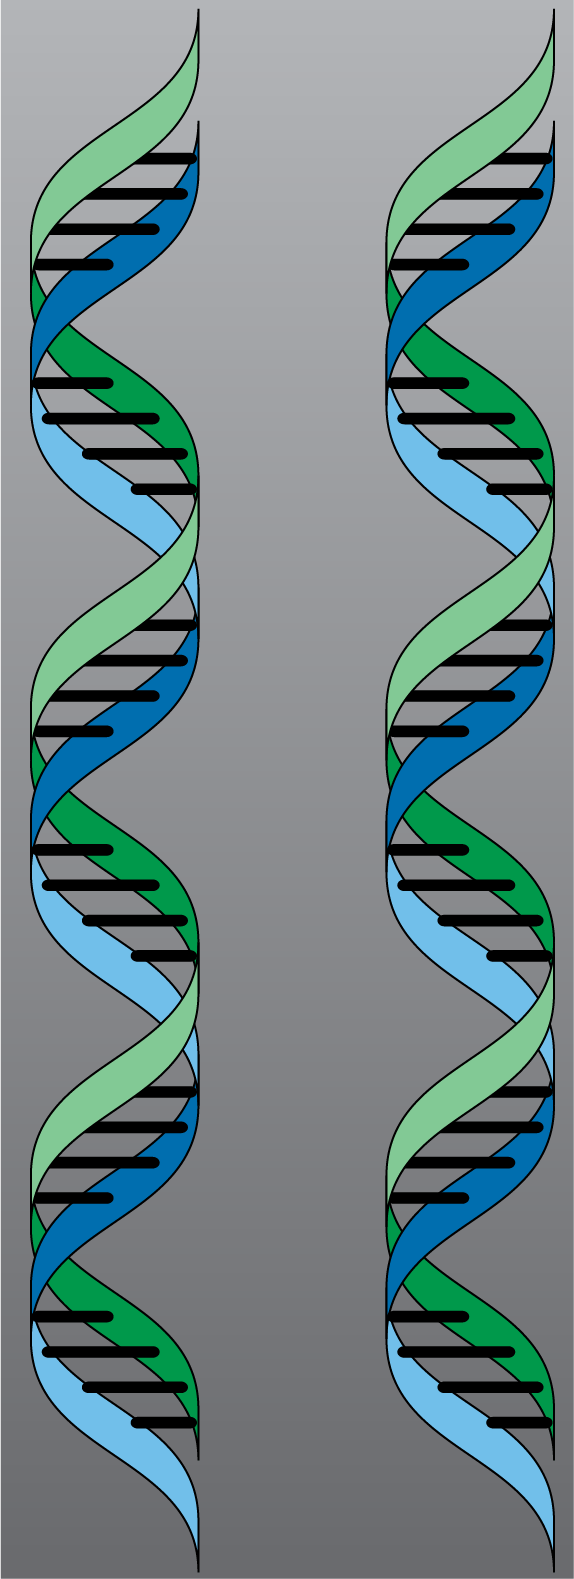
One way would be to examine fragments of DNA. DNA is a polymer composed of nucleotides—small molecules that ostensibly contain no identifying information themselves, but can be combined to encode the information of life.

Recovering and analyzing relict DNA can inform the identity, ancestry, and traits of an organism.

DNA is inherited, remixed, and replicated. The history of life—ours and our ancestors’—is recorded in it.

The right fragment of DNA could certainly distinguish between an alligator and a crocodile, and perhaps even identify an individual, if reptilian crime units had an interest in this sort of thing.

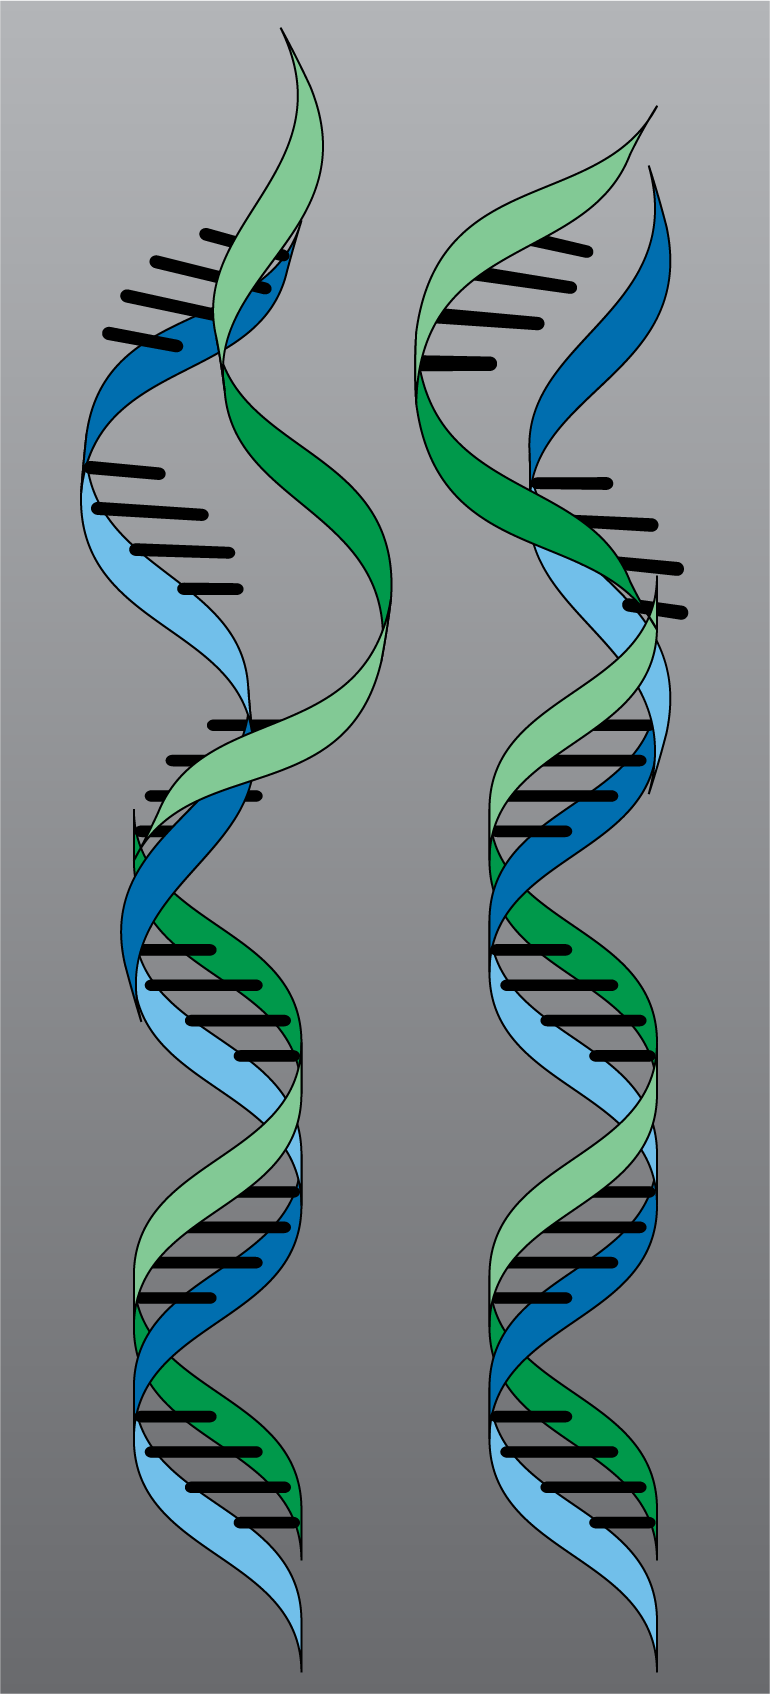
But DNA degrades...

Polymers can break down into their constituent compounds.

DNA degradation happens all the time, even in the bodies of living organisms. As the DNA of an organism falls apart, do all identifying features go with it?

Molecules have memories

Even simple molecules retain information about their origins.

This information is encoded in the isotopic composition of their constituent atoms.

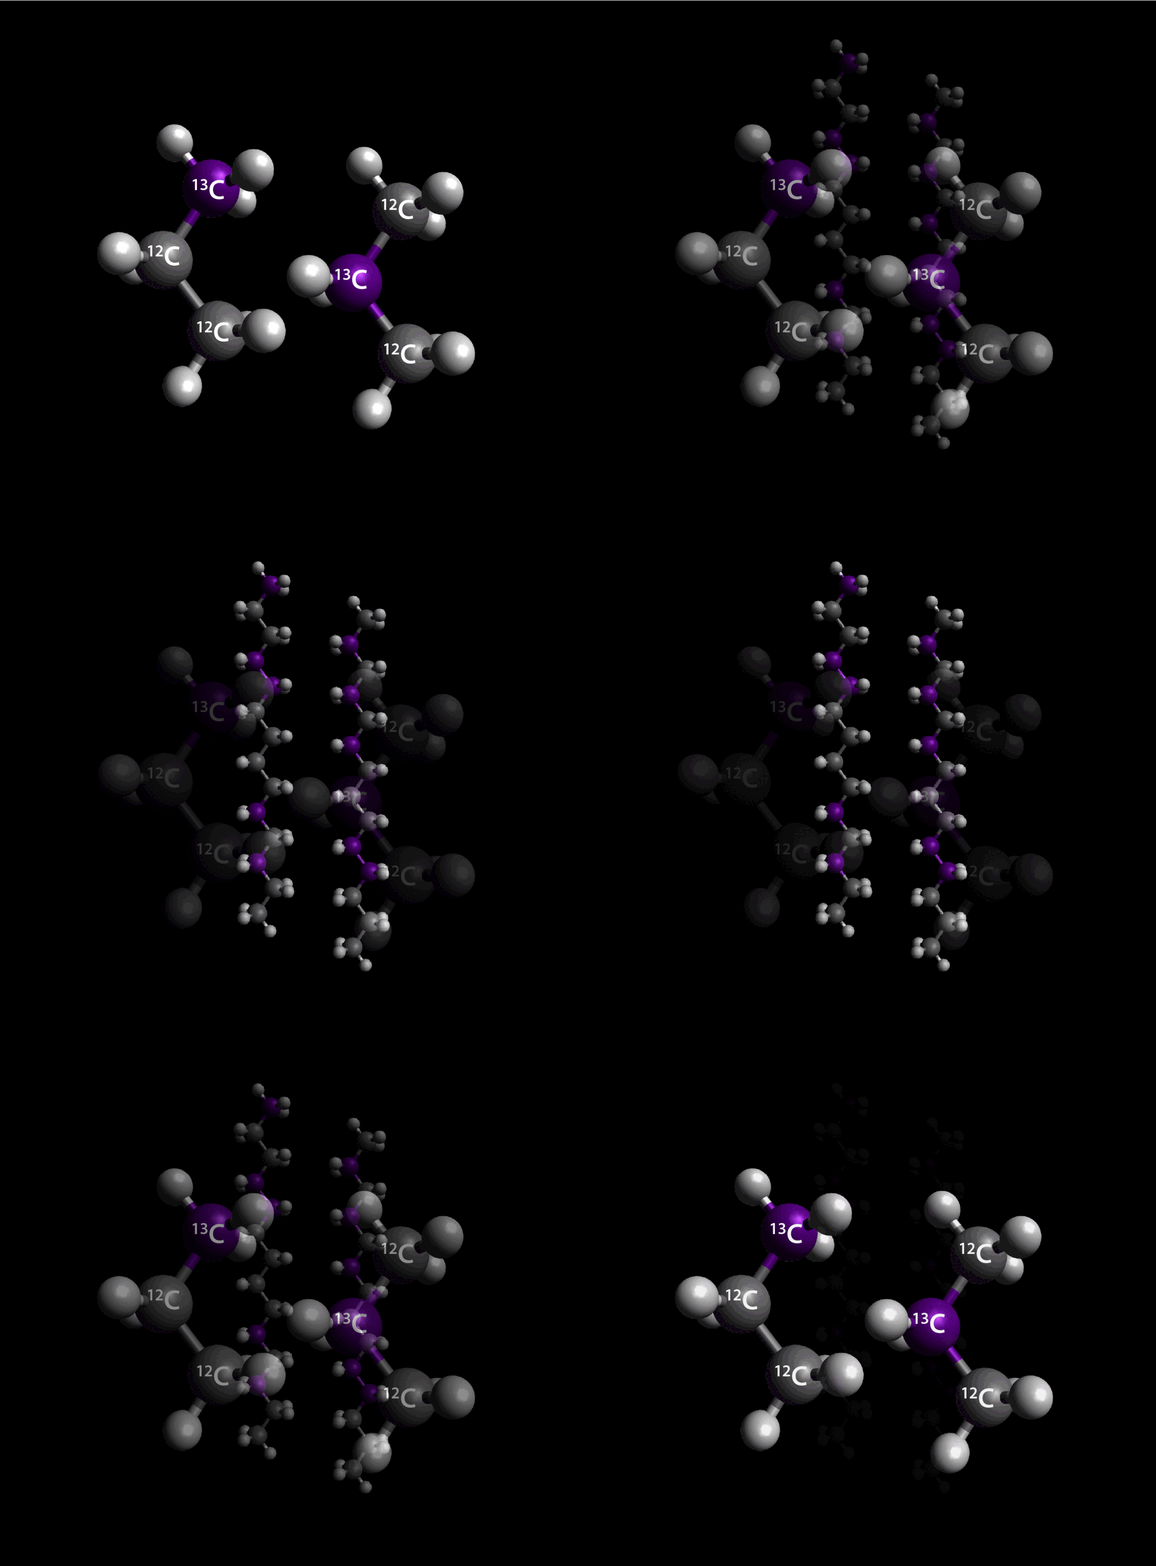
Most elements have multiple isotopes that can be found in nature in reasonable abundance. The chemical blueprints for molecular construction specify which elements go where, but are mostly agnostic of which isotopes are used. Thus, like a stream of bits that store data based on which sites are “0” and which are “1,” molecules encode information in the pattern of isotopic substitutions of their atoms.

Thus, different iterations of the same molecule are distinguishable based on their isotopic substitutions. These are called isotopologues.

What can isotopologues record?

Isotopologues are sensitive to a molecule’s history of formation, transport, and storage.

Most chemical reactions can discriminate between isotopes of the same element. The abundance of certain isotopologues informs on the reactions that led to a population of molecules existing in a certain place and time.

This is not restricted to organic molecules and biologic processes: not only can the nucleotides that constitute the DNA of crocodiles and alligators perhaps be distinguished based on their isotopologue abundances, but also oxyanions produced by different abiotic reactions (citations) and gases from different sources (e.g., Labidi et al., 2020; citations).

If a chemical species contains (or once contained) chemical bonds, the isotopologue abundances of this species can probably help constrain the history of the formation (or breakage) of these bonds.

Hasn't this all been done before?

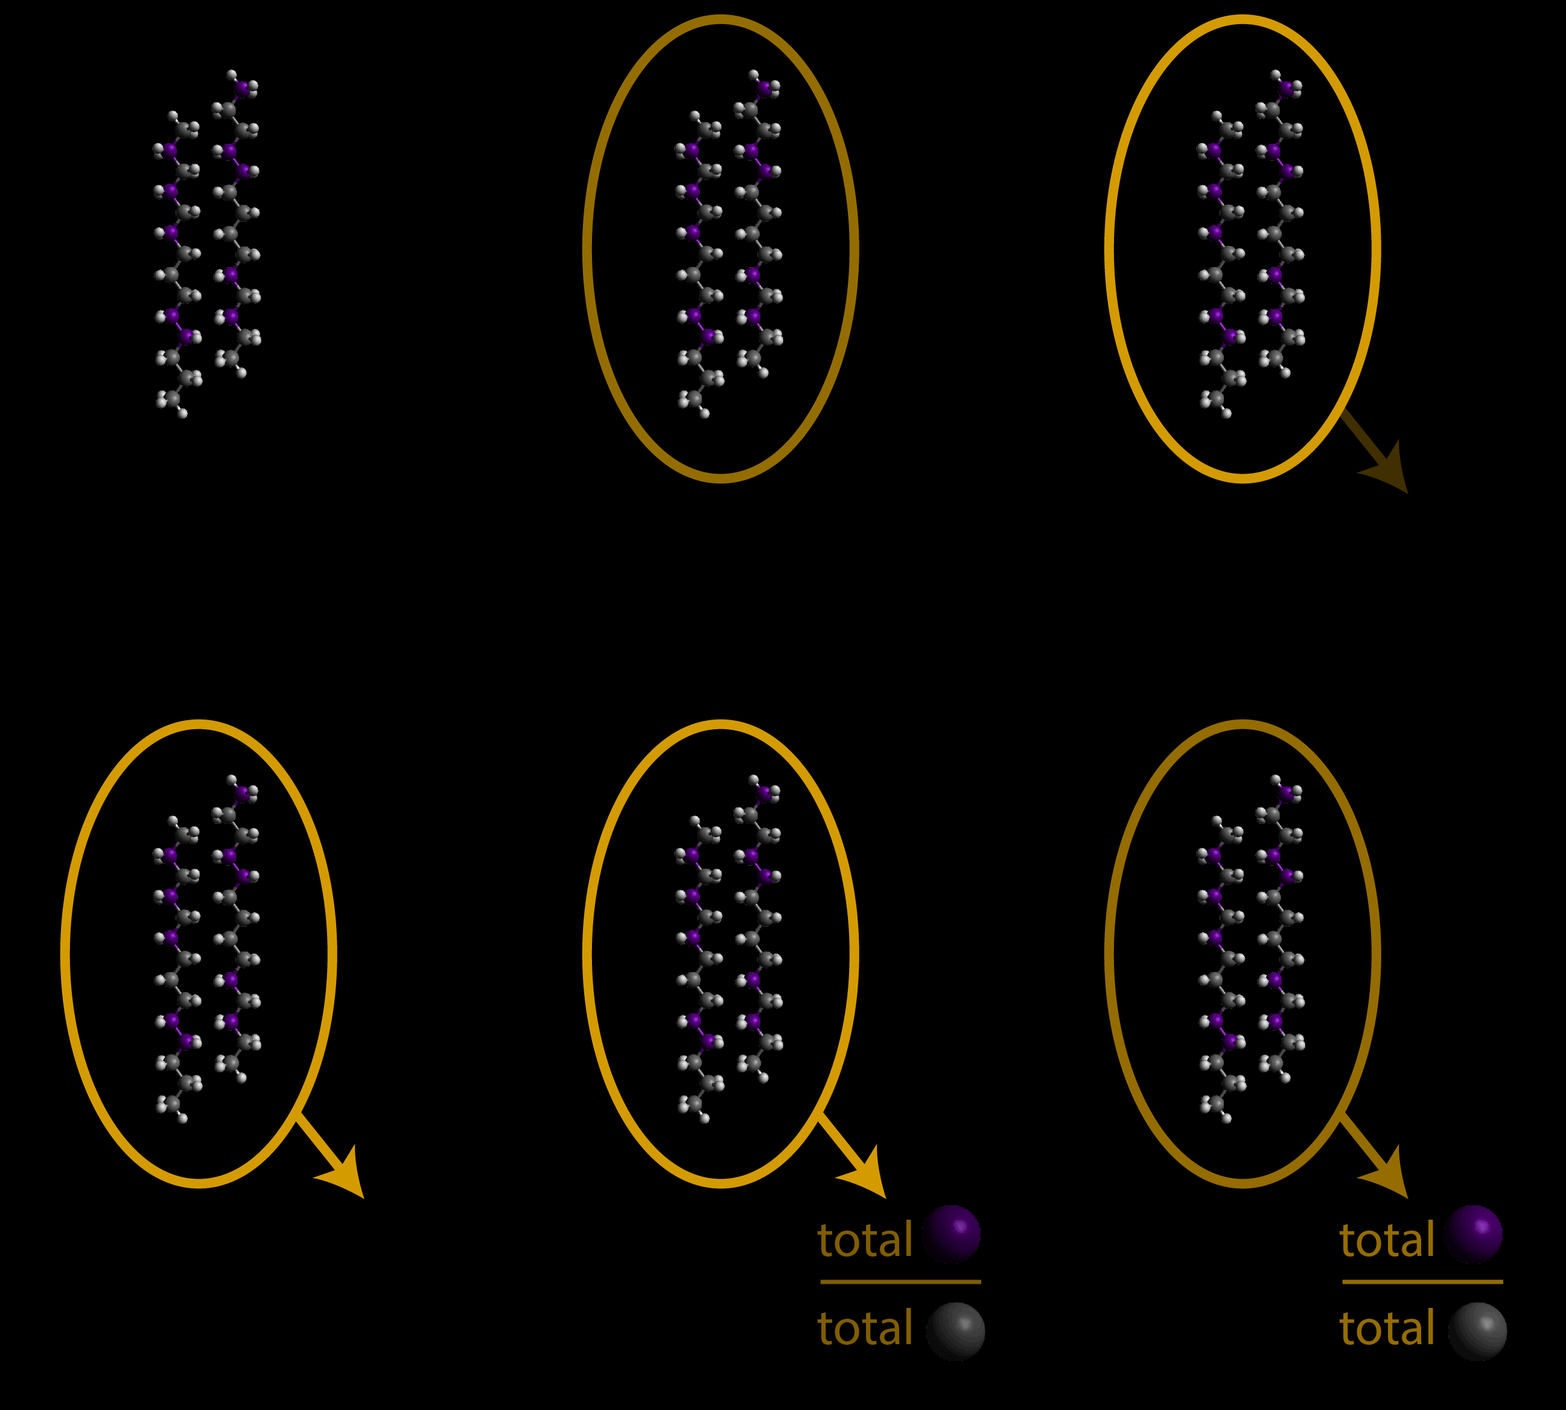
Isotopic abundances have long been used to understand nature. However, isotopic analyses have mostly been limited to elemental averages across the smallest physically separable component, like a scoop of solid matter, a family of compounds with similar physical/chemical properties, or (at best) single compounds.

Such elemental averages are relatively straightforward to obtain and high-throughput, but in the process of generating these “bulk” isotope analyses, all information about the molecular position of isotopic substitutions is lost.

This is like sticking an alligator in a blender and trying to tell the difference from a pureéd crocodile based on its nutritional content; it can probably be done, but wouldn’t it be easier if you could keep the organism intact?

Welcome to the isotopologue age

Now, new technologies are enabling the prediction and observation of isotopologue abundances of a diverse array and unprecedented number of compounds.

These analytical and computational developments have applications in a wide range of fields, including forensics, biogeochemistry, food and drug authentication, and space science.

In essence, if the provenance of a molecule provides a useful constraint on a question or hypothesis, isotopologue analyses could be a useful tool to address it.

Why isotopologues?

Isotopes of a given element have the same number of protons and electrons, which play the largest role in determining an element’s chemical characteristics, but they have a different number of neutrons and therefore differ in terms of their atomic mass. This mass difference may lead to the separation or partitioning of two isotopes (e.g., 13C and 12C)—a process known as isotopic fractionation—between phases, among different compounds, through reaction networks, or via physical processes such as diffusion or gravitational escape.

Measurement of the isotopic ratio of a given compound combined with geochemical context can provide valuable insight into the source reservoirs and formation pathway(s) for that particular compound and/or enable reconstruction of the physical/chemical/biological processes that led to the observed isotopic signature.

What are some advantages of isotopologue analyses?

Some processes isotopically fractionate based on the mass of an entire molecule, such as diffusion or gravitational separation.

Processes that break or form chemical bonds isotopically fractionate at or near the site of the reaction.

Molecule-averaged

Molecule-averaged isotopic analyses cannot distinguish such processes.

Isolopologues

Isotopologue analyses can.

Conventional analyses

Conventional analyses destroy molecules in oxidizing or reducing environments to convert their atoms into simple gases, like CO2, N2, CO, H2, or SO2. At best, C, N, and S isotope ratios can be analyzed together, at the expense of O and H.

Isotopologues

Keeping molecules intact means that all constituent elements can be analyzed in the same compound at the same time, including metals that might be lost if the molecule was destroyed.

Molecule-averaged

Molecular-averaged isotopic compositions are only meaningful when compared to some external reference frame.

A methane δ13C value of –70‰ vs. VPDB is only ‘light’ relative to another carbon pool, like a CO2 substrate at –20‰.

It is hard to interpret the δ18O value of a carbonate from a martian meteorite without knowing the isotopic composition of the formation fluid, which is long gone.

The average δD value of an organic molecule is complicated because different hydrogen atoms may have been added at different times, in different biologic compartments, from different source pools.

Isotopologues

Site-specific isotope analyses have built-in reference frames. The relative abundance of an isotopologue can be compared to the expected abundance at some other state, such as a randomized (“stochastic”) distribution or at internal equilibrium at a given temperature.

Built-in reference fames mean that single observations have intrinsic meaning. We can interrogate whether a molecule or mineral has internally equilibrated (and at what temperature) even in the absence of other constraints. Deviations from equilibrium can similarly be assessed and compared.

Fundamentals of isotope fractionation

This module briefly summarizes processes that fractionate isotopologues. For a deeper dive check out unit IV.

Contents

  1. Whole-molecule fractionation
  2. Irreversible, position-specific fractionation
  3. Reversible, position-specific fractionation
  4. Non-mass dependent fractionation

Whole-molecule fractionation

Some processes do not discriminate between isotopic subsitutions at different molecular sites.

When molecules are physcially transported from one place to another, the total mass of the molecule tends to matter most.

For instance, diffusion and gravitational separation fractionate among isotopes, but not necessarily between isotopologues.

Note however that if molecules interact with the medium during transport, site-specific isotope effects can still occurr (e.g., Fox et al., 2021)

Irreversible, position-specific fractionation

Many chemical reactions that break or form chemical bonds have regioselectivity: That means that they favor reaction at one particular molecular site over others.

Heavier isotopes form stronger bonds that are less likely to break. So, among a population of molecules undergoing a chemical reaction that acts on a specfic molecular site, isotopologues with heavier isotopes at participating positions will tend to react more slowly on average. As the reaction proceeds, the product pool will typically be depleted in these heavy isotopologues and the substrate pool will be enriched. Isotopolgues with heavier isotopes at other, non-participating sites will not be discriminated against as strongly. Thus this chemical reaction will impart a position-specific isotope effect. Remember that once a reaction goes to completion (all substrate has become product), mass balance means that this effect will no longer be expressed.

In chemical reactions, positon-specific isotope effects tend to be the rule, not the exception. This includes reactions medaited by abiotic and biologic catalysts (enzymes), which are often highly regioselective.

Isotopic inheritance

An outcome of regioselectivity is the principle of isotopic inheritance. Molecular sites in the products of regioselective chemical reactions are more likely to be sourced from certain molecular sites in the reactants. So, molecular sites in reaction products inherit the isotopic composition of corresponding sites in substrates, modulated by any position-specific isotope effects associated with the reaction itself.

For example, when two-carbon acetic acid is pyrolyzed into one-carbon products methane and carbon dioxide, the methane (CH4) tends to inherit the isotopic composition of the methyl group (CH3) in the substrate and the carbon dioxide (CO2) samples the carboxylic acid (COOH).

Note that mass balance means that isotopic inheritance matters whether or not a reaction has gone to completion.

Reversible, position-specific fractionation

Many chemical reactions are reversible, and run in both directions. When the forward and reverse rates of a reaction are finite, non-zero, and adjust to compensate for a samll perturbation to the system ( e.g., addition of extra product or substrate), a reaction is said to be in chemical equilibrium. If the above conditions are met and the distribution of isotopologues in the product and substrate pools are unchanging, a reaction would be in isotopic equilibrium.

How are position-specific isotope effects, which arise from different reaction rates in different isotopologues, expressed if forward and reverse reaction rates are equal? Since heavy isotopes slow reaction rates, isotopologues with heavy substitutions will have longer mean residence times in stable phases compared to unsubstituted counterparts. At equilibrium, heavy isotopologues will tend to concentrate in the phase in which they are most stable (i.e. lowest free energy) compared to light isotopologues. This tends to be the phase with the stiffest bonds, where isotopic substitution gets you the most "bang for your buck." Often this is the phase where the atom has the highest oxidation state or the lowest coordination number. These are equilibrium isotope effects. Check out Schauble 2004 for more qualitative rules of thumb for predicting the direction and size of equilibrium isotope effects.

At higher temperatures, bonds vibrate faster and break more frequently, and so the small differences in bond strength and reaction rate from heavy isotopic substitution become less pronounced. Entropy wins out over enthalpy. The size of equilibirum isotopic fractionations decrease, roughly in proportion to 1/T2. Since equilibrium isotope effects scale with temperature, they can be used to constrain the temperature of a system when a equilibrated state is preserved.

Non-mass dependent fractionation

All of the previous isotope effects were mass dependent. Because these effects scale with atomic mass, they fractionate among elements with more than two istopes (e.g., oxygen, sulfur) in predictable ways. For example, because the mass difference between 18O vs. 16O is twice that of 17O vs. 16O, isotopic fractionations in δ18O vs. δ17O tend to correlate along a slope of 2.

Other types of chemical reactions do not discriminate based on mass but rather based on difference. XXX more here XXX

Notation and visualization

How do we describe and visualize isotopologue distribtutions?

Contents

  1. Notation
  2. Visualization

Hello, delta

δ = R sample R std - 1 × 1000

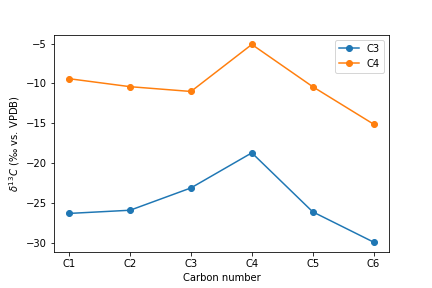
Observations of isotope ratio (e.g., 13R = 13C/12C) are typically described relative to some external value, such as the istope ratio of the Pee Dee Belemnite (13RVPDB ≈ 0.011228). These relative differences are commonly described using permil notation, as shown above. In fact, molecular average isotope ratios only have meaning relative to some other value.

Compared to what?

Isotpologues measurements don't have to be referenced relative to an external standard. Intead, various built-in reference frames can be used. Choice of standard used (i.e., the *reference frame* for a measurement) can change how a measurment is interpreted. In the following slides we overview some difference reference frames, and show how it changes how data are visualized.

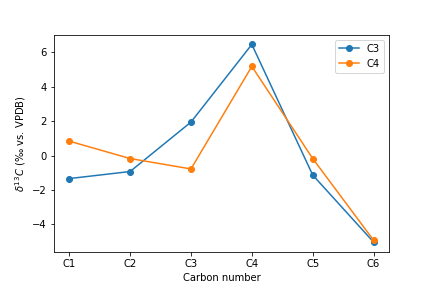
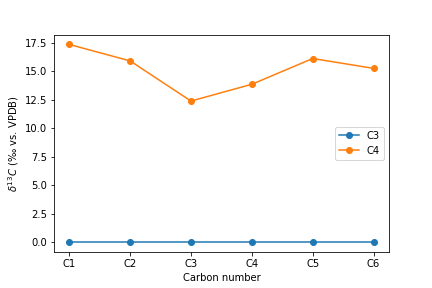
As an example, we change the reference frame for the position-specific isotope data from Rossmann et al., 1991. To see how we do this, you can check out the notebook here.

Possible isotopologue reference frames

  • External standard
  • Molecular average
  • Internal lab standard
  • Randomized
  • Equilibrium

External laboratory reference frame

Most common in standard isotopic work is comparison relative to an international standard, like the Pee Dee Belemnite. Plotting the position-specific glucose from C3 and C4 plants from Rossman et al., 1991 in this standard way is shown above

Molecular average reference frame

Another option is normalizing isotopologue data to the molecular average for a particular compound. This eliminates differences in isotopic composition between different compounds and highlights differences within them.

Internal laboratory reference frame

In new isotopologue meausrements, one of the most challenging roadblocks is figuring out how to project samples into an absolute reference frame like the ones shown above. If different molecular positions are measured in different ways, there is no guarantee that results will even be comparable relative to each other!

In these cases, the most conservative reference frame is an internal relative reference frame. Here, two compounds are measured in the **exact same way**, and the results of one compound are reported only relative to the other.

This approach has advantages (it can usually always be done), but also drawbacks. A set of results only has meaning as long as the standard can be shared or independently measured.

Above, the glucose data are plotted using the C3 data as an internal relative reference frame. Obviously this means that, by definition, the values for C3 are now zero.

Randomized reference frame

XXX...

Equilibrium reference frame

XXX...

Reference frame comparison

Name Traceable? Position-specific? Condition-specific?
Internal std
External std
Molecular average
Randomized
Equilibrium

How to choose?

The purpose of a reference frame is often to eliminate a source of variability.

The right choice of reference frame should help evaluate a hypothesis by "seeing through" other sources of variability

.

Visualization

People think in 2D...

Contents

  1. Abundance vs. position
  2. Abundance vs. abundance
  3. Multivariate approaches

Isotopic abundance vs. position

Fingerprints

Linear but also non-linear! (radial plots?)

Isotopic abundance vs. abundance

sample vs. sample or site vs. site?

Multivariate analysis

PCA to reduce dimmensionality

Visualization overview

The purpose of a reference frame is often to eliminate a source of variability.

The right choice of reference frame should help evaluate a hypothesis by "seeing through" other sources of variability

.

Applications

People blah...

Contents

  1. Biogeosciences
  2. Molecular forensices
  3. Petroleum exploration
  4. Space science

Biogeosciences

Fingerprints

Linear but also non-linear! (radial plots?)

Molecular forensics

Fingerprints

Linear but also non-linear! (radial plots?)

Petroleum development

Fingerprints

Linear but also non-linear! (radial plots?)

Space science

Fingerprints

Linear but also non-linear! (radial plots?)